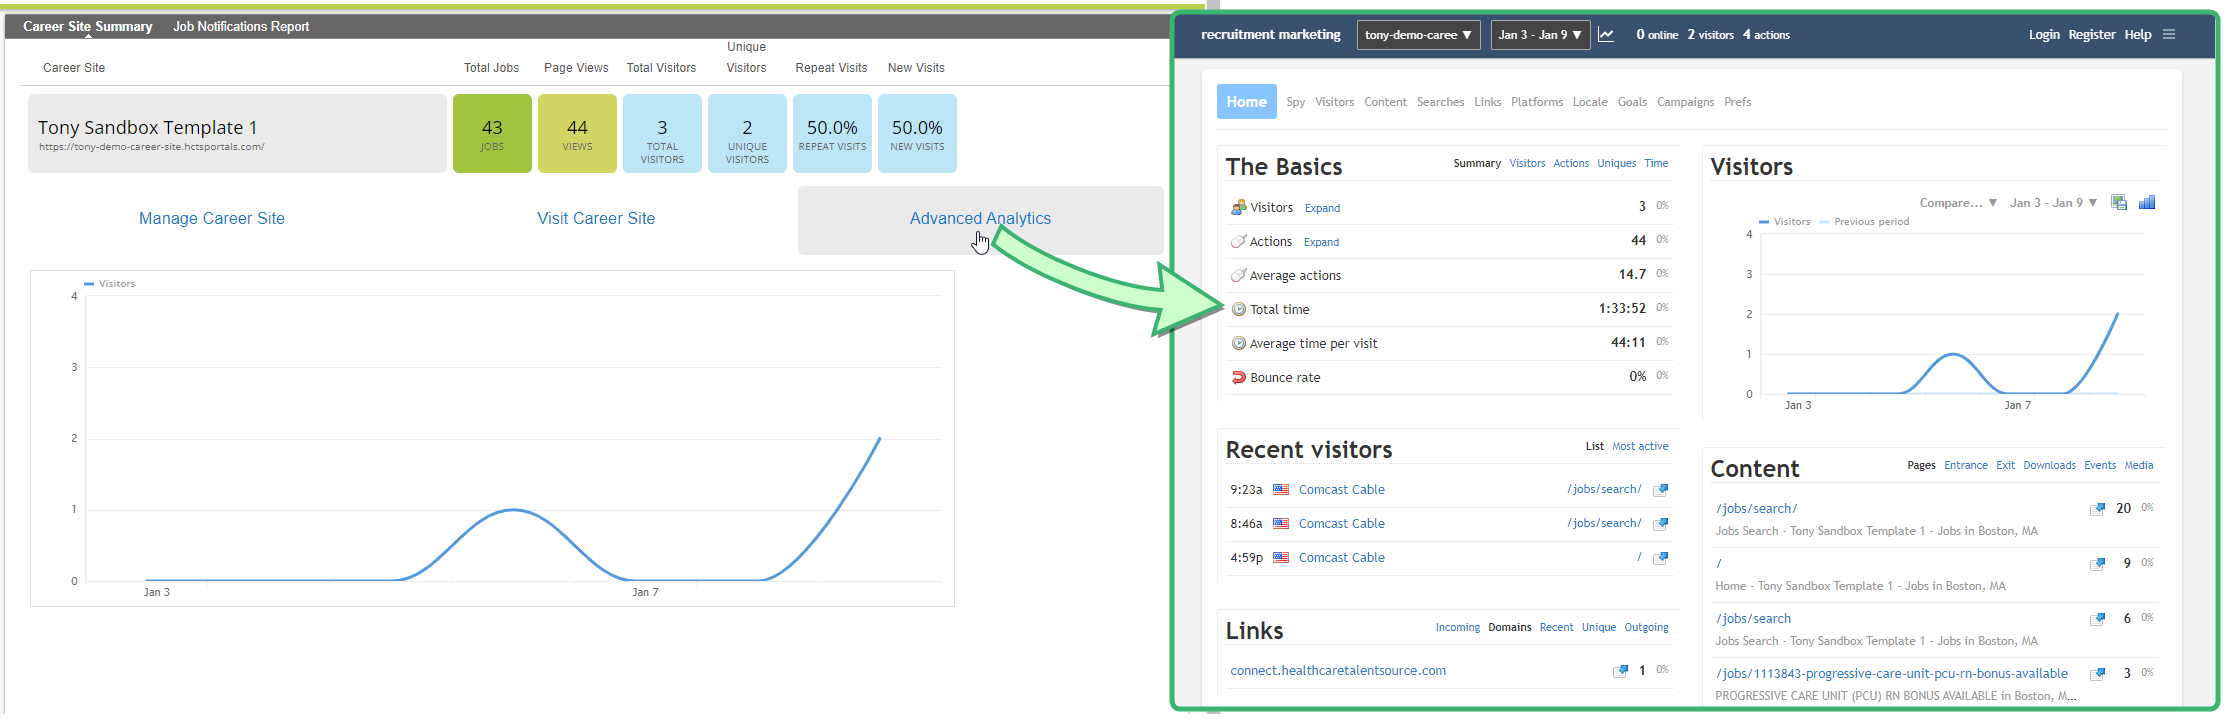
Advanced Analytics
Advanced analytics is a tool that provides in-depth usage data throughout all your career sites. Powered by Clicky, these analytic reports can tell you who's viewing your sites, how they found their way there, what they're clicking on, and other valuable details you can use to fine-tune your jobseeker application process.
Selecting Advanced Analytics on the Career Site Summary page displays Advanced Analytics in a new browser tab.
Note: This page provides a basic overview of what's possible using Advanced Analytics. For more extensive details about how to use particular features, please refer to the Clicky online help site.
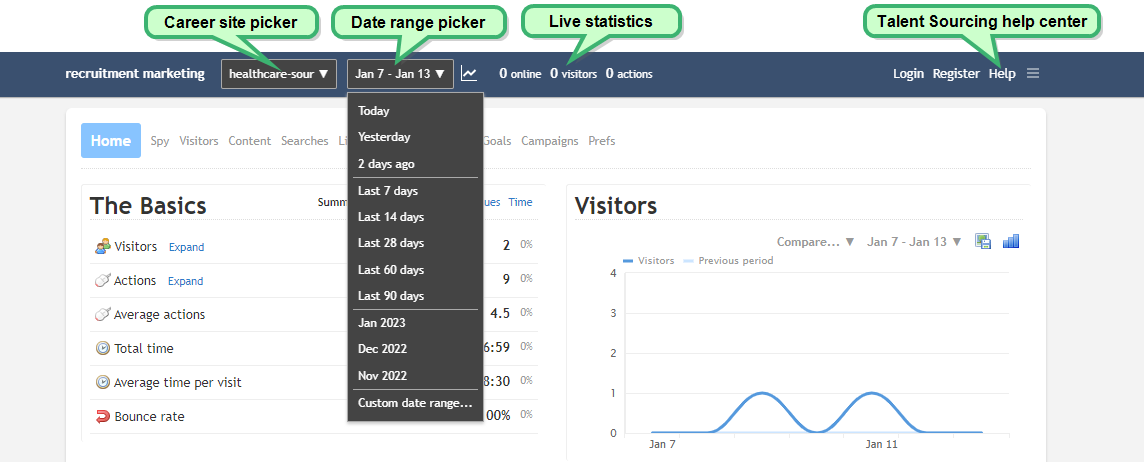
This Home page serves as a starting point, giving you a quick summary of your site data at-a-glance. The blue header bar along the top of the page contains various options to choose a career site to look at (for accounts running multiple sites), a date range picker for viewing data from particular days, and live site statistics that show how many people are using the site.
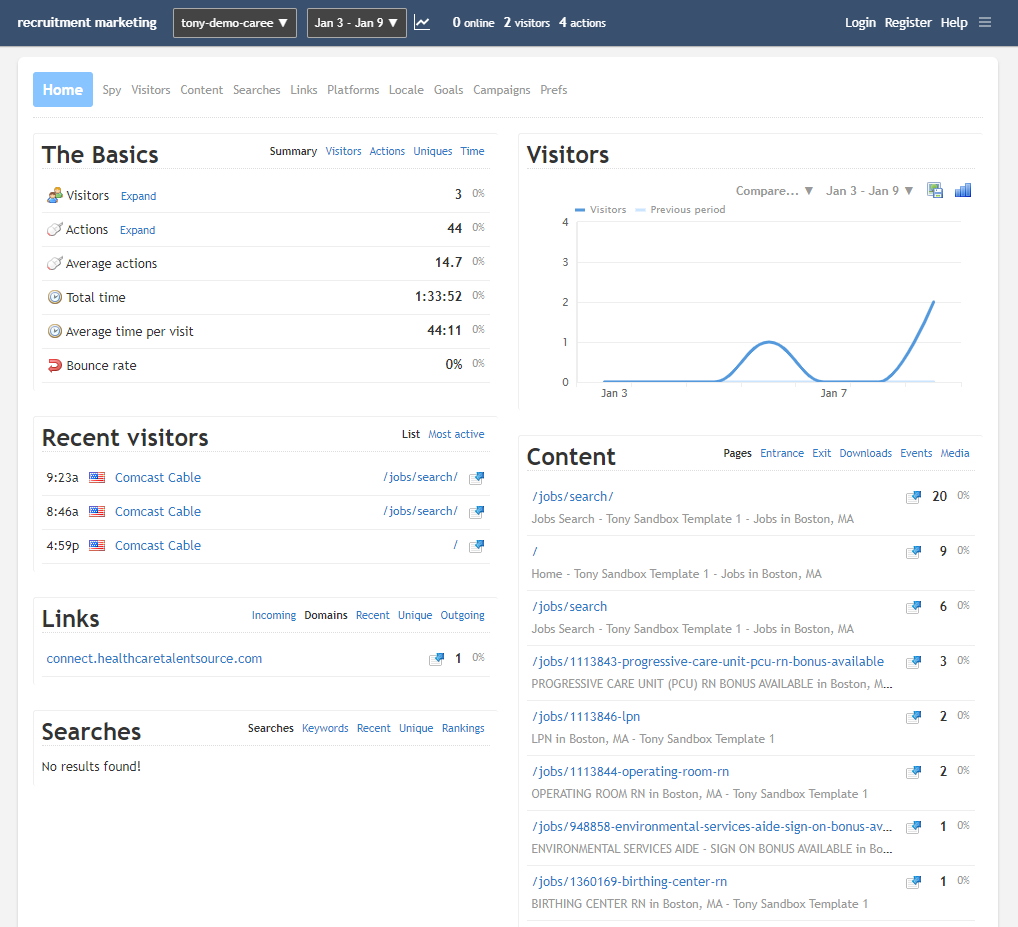
Information across the various categories is automatically displayed underneath the header and navigation bar. These most commonly-used segments of data include:
-
The Basics. This summary includes counts of visitors and actions taken, total and average time spent on the site, and bounce rate. Selecting one of the other heading options in this panel lets you view additional metrics tailored to site visitors, actions, and more.
-
Recent Visitors. Displays a list of the most recent site visitors. You can also view the most frequent visitors by selecting the Most Active heading.
-
Visitors. A visualization of your site metrics. This panel can be customized by applying different chart/graph options and date range settings.
-
Content. Lists the most-viewed pages in your career site. You can see activity on specific types of pages (landing, events, calls-to-action, etc.) by selecting their respective heading options.
-
Links. Displays what sites have been bringing visitors in, where visitors go when they leave, and other domain-related metrics.
-
Searches.Shows a listing of what terms career site users have been entering in your search bars. This is especially useful for discovering what jobs or categories are the most popular with your visitors.
-
Locale. Where your page visitors are located. View data based on country, state, city, language used, and more.
-
Traffic Sources. Displays how many users are accessing your career site by entering a direct URL into the address bar, or if they're being referred by clicking a link from an email or external site.
If you'd like to delve deeper into a specific subset of data, select the desired category from the row of options along the top of the page. Additional pages consist of the following:
-
Spy. Displays a real-time stream of visitors and actions on your website happening right now, in real-time. View a global map of where your site visitors are located. A list showing up to the last 40 actions on your website displays here too.
-
Visitors. The visitor log shows a reverse chronological log of all visitors to your website for the date range selected. It allows you to quickly view the most common landing pages and referrers, and allows you to dig deeper into any session that catches your interest.
-
Content. The main content reports show the most active pages on your website, determined by the number of page views. Other sub-reports are also included, such as downloads and exit pages.
One important thing to note about all of the content reports are that they are based on the number of views, not visitors.
-
Searches. Lists exactly what career site users are entering in their search queries.
-
Links. Displays various details about referral links. Incoming links are referrers - when someone clicks a link on another site that leads to your site. Browsers pass this data along, giving access to that data. This is convenient because you know what sites are linking to you and how much traffic those links are generating.
The Domains report groups together referrers by domain, so if a site has more than one link to you, you can see the total traffic being generated from that domain in this report.
-
Platforms. View the system configurations used by visitors. Information includes web browser, operating system, screen resolutions, and hardware.
-
Locale. See another listing of where your visitors are located.
-
Goals. A goal is a page on your website that a visitor reaches once they have made a purchase or completed another desired action, such as a registration or download. By setting up and tracking goals, you can determine how effectively your website is driving your visitors to these desired actions.
Goals can be pre-defined and trigger automatically when visitors view pages on your site that match patterns you define, or you can declare goals manually via Javascript on your site.
-
Campaigns. Campaigns are generally used to help you monitor your marketing efforts for your website. Common types of marketing for most sites would be ads on search engine result pages and/or social media.
There are two different ways to track campaigns. The easiest method is to use the dynamic UTM parameters that are now supported by most analytics services. The other way is to pre-define landing pages or referring domains that are generally only used for inbound marketing purposes. These are called static campaigns.