Formatting Reports
Reports in symplr Recruiting can be reformatted and reconfigured in a multitude of ways. By adding, removing, and rearranging columns, toggling column sorting order, and applying conditional formatting, you can truly display your columns in the way that is best for you.
These actions can be performed on one, several, or all columns at once, depending on the selected actions.
-
Change Sort Order. Clicking a column heading changes the sorting order of the data based on that one column. Columns can be put in ascending order (indicated by an up arrow) or descending order (indicated by a down arrow). Clicking a third time removes the sorting arrangement.
-
Move Columns. Clicking and dragging a column heading enables you to move it over in the display, to the left or to the right.
-
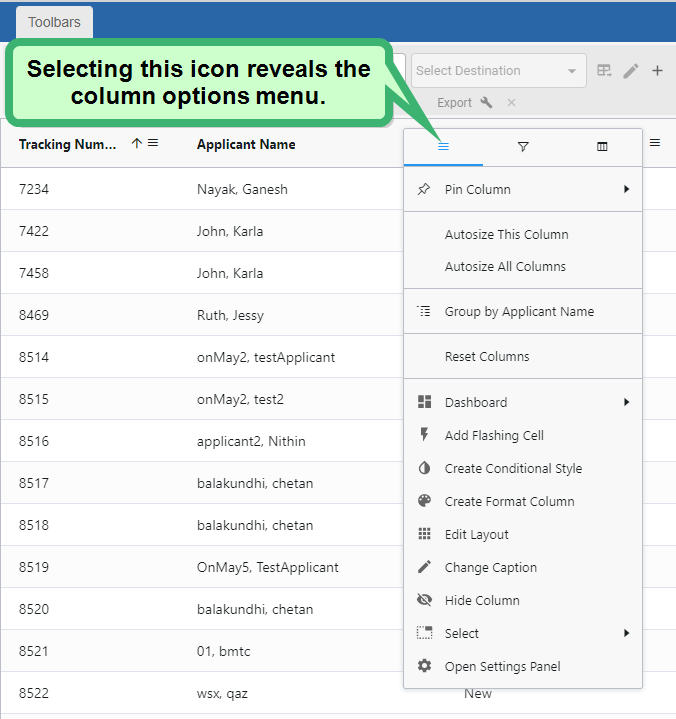
Column Options. Selecting the menu icon in a column header displays an options menu containing several options to pin a column in place, resize columns, hide the column, change groupings, add conditional formatting, and more.
The sidebar offers more options filter data, adjust columns, or use configurable reporting features.
-
Filters. Allows you to filter the report data to include or exclude data according to specific conditions and parameters specified by you.
-
Columns. Provides a listing of all available columns in the report, and you may add or remove whichever ones you'd like. You can enable pivot table mode by toggling the Pivot Mode switch at the top of the sidebar. Configure row groups and aggregate values in this section, while viewing in-depth data breakdowns using advanced options like Column Labels.
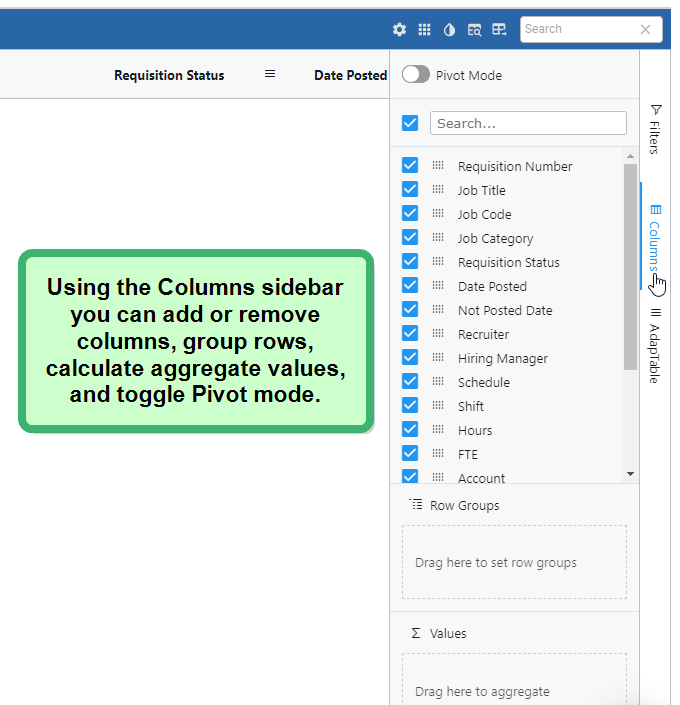
Note: Pivot Mode lets you create your own custom pivot tables, directly within symplr Recruiting! This saves you time and effort by reducing the need to export your data to Excel.
-
Adaptable. Contains options to reconfigure the Toolbars display, export the report, filter data, create and load custom layouts, and run a quick search.
These settings and options can be found in the Settings Panel, which displays after selecting the gear icon on the report dashboard. Many of these options may also be selected from the Toolbars tab or the various other icons along the report dashboard.
-
Dashboard. Affects the look and feel of the Dashboard area (the top-most bar along the top of the report containing the title). Contains options to adjust how the Dashboard displays, including what features are available in the Toolbars menu and Settings buttons.
-
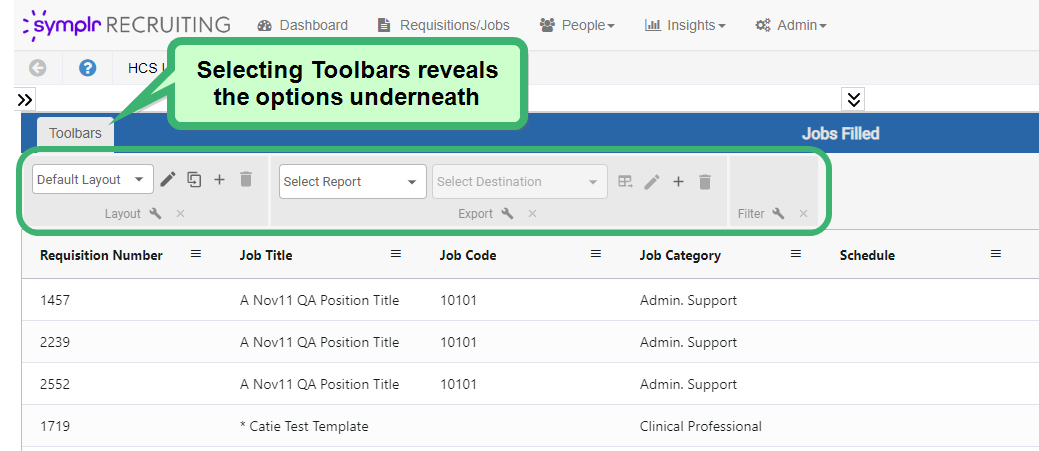
Toolbar Panels. Selecting Toolbars displays the toolbar tabs. The tabs that display here depend on how they are configured in the Dashboard area of the Settings Panel. By default, the Layout, Export, and Filter tabs appear here.
-
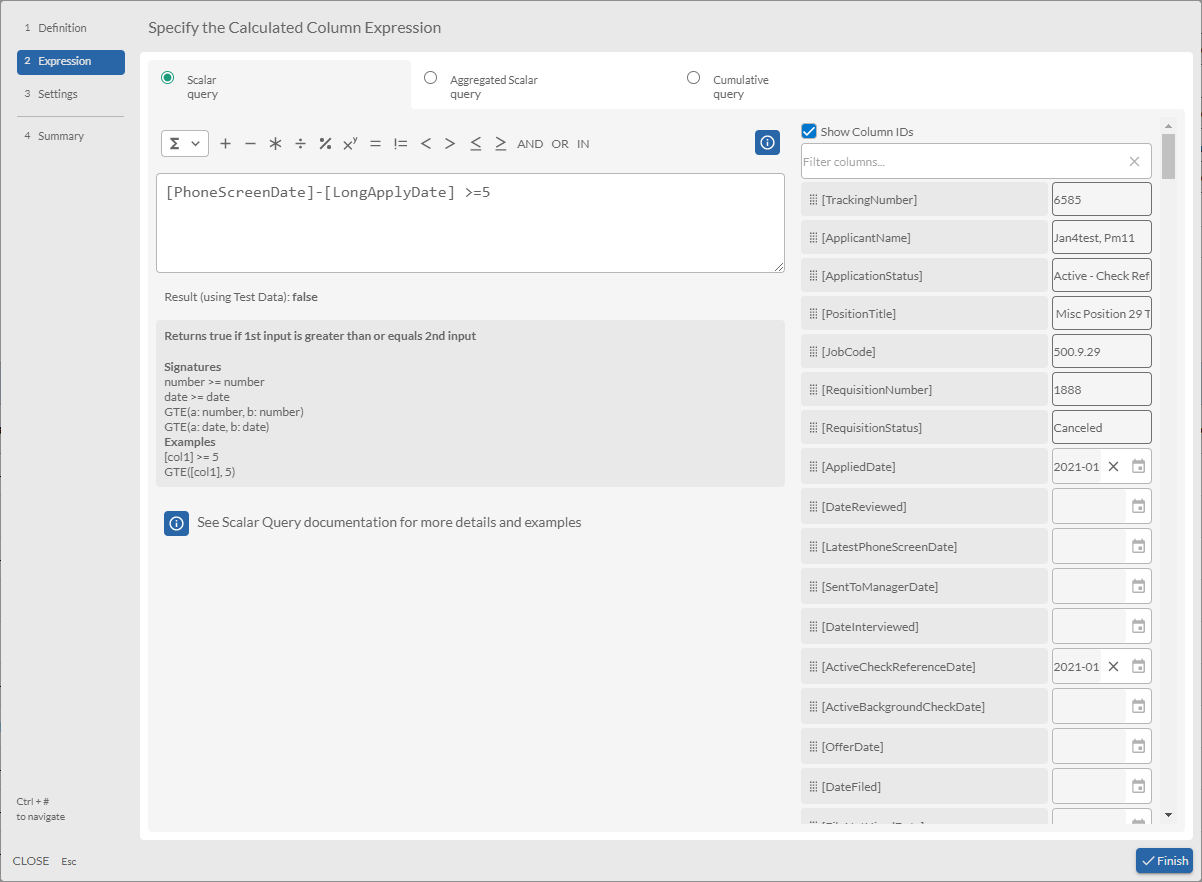
Calculated Columns. Calculated columns are special columns which display calculated values. With this powerful feature, you can create your own custom dynamically-calculated column expressions. Expressions can be made in Scalar (based on other cells in the row) or Aggregated Scalar (based on other rows in the grid) formats. Once created, a calculated column can be used and managed like any other report column.
-
Conditional Style. Conditional styling can be configured here by selecting the +New button. Using this feature, you can set your reports to display individual row or column cells in specific colors and styles when certain conditions are met (for example, show Days to Hire cells with red background and bold, yelllow text if count is greater than 60).
-
Export. Contains options to export the current report to an Excel (.xlsx format) or CSV file. You can set which columns and rows will be sent over in the export and even customize the report name.
-
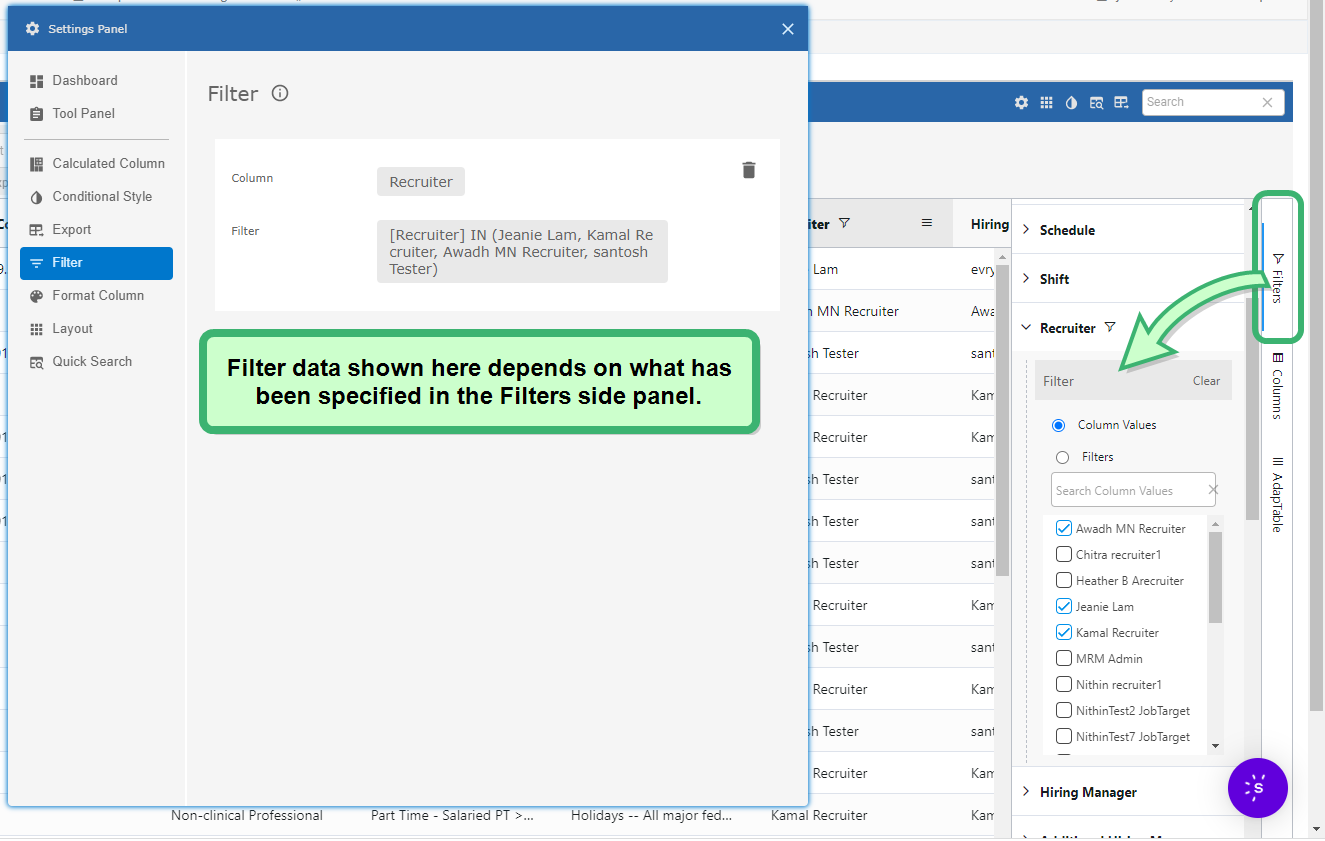
Filter. Selecting this tab on the Settings Panel shows any filters currently being applied to the report. To apply a filter to the report, you need to select the Filters side panel on the right-hand edge of the report and configure those values as desired. Existing filters can be removed here by selecting the Trash Can icon.
-
Layout. The Layout area displays the current report configuration. In addition to the layout name, it also shows the grid type (basic table or pivot), columns, and filters. Existing layouts can be cloned, edited, and saved with custom names for faster and easier access to the data you need most. You can customize the report's results, including pinning grand total counts and values to either the report's top or bottom row.
-
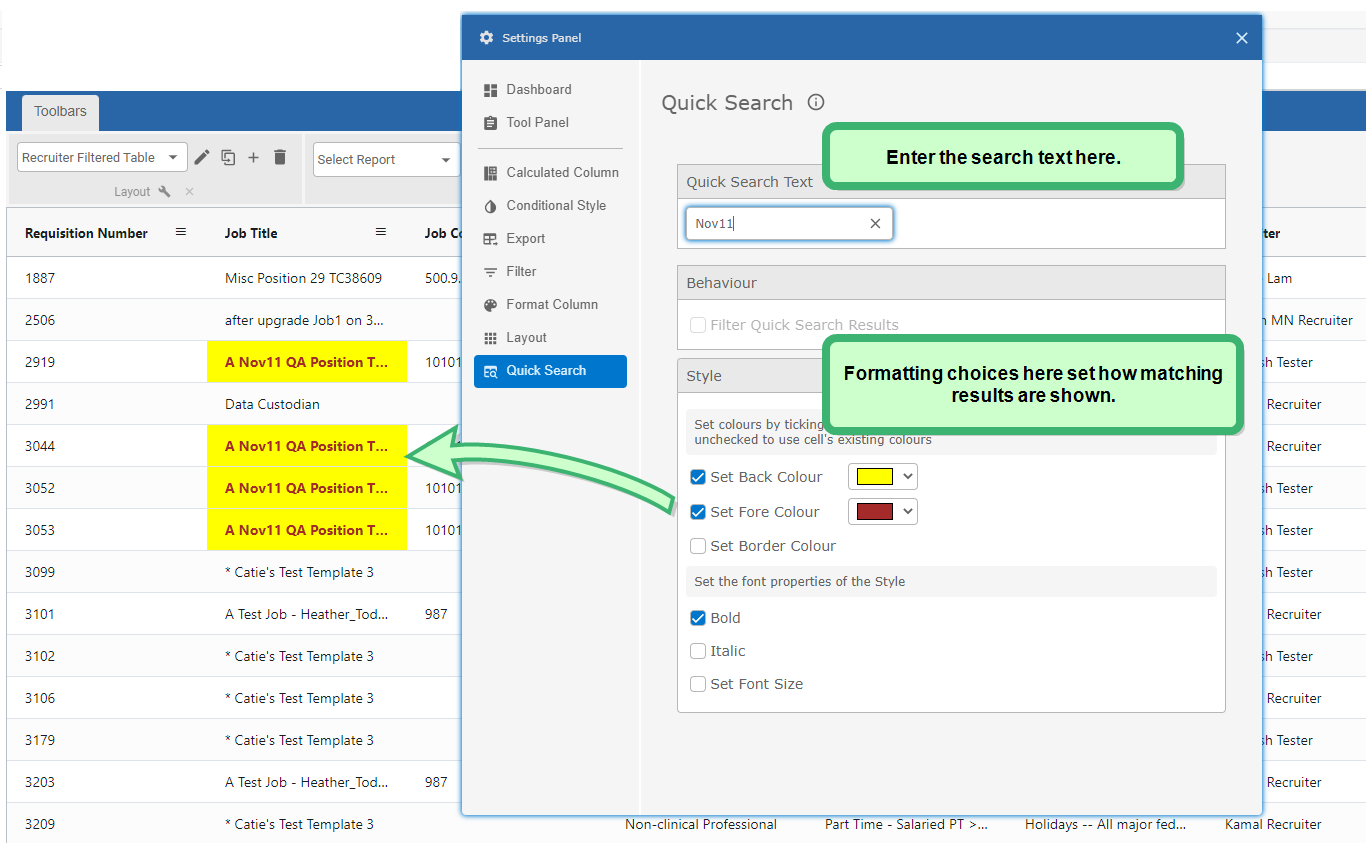
Quick Search. Quickly searches the entirety of the current report for content matching specific text characters, similar to using a CTRL+F search function. Using Quick Search also enables you to format any matching content however you need- especially useful if you need certain elements to "pop" on the page. After formatting is applied during your search, it will remain even after closing the Search window.